- Physics Lab Equipment
- Chemistry Lab Equipment
- Biology Lab Equipment
- Anatomical Lab Equipment
- Learning
- Educational Lab Equipment
- Magnets
- Agriculture
- Astronomy
- Earth Science
- Geography Lab Equipment
- Safety Lab Coat
- Laboratory
- Meteorological
- Electricity & Magnetism
- Heat
- School Lab Equipment
- Lab Glassware
- Science Lab Equipment
- Tvet Lab Equipment
- Robotics Kits Supplier and Manufacturer for Schools India
- Math Lab Equipment Manufacturers and Exporters in Ambala
- STEM Kits Manufacturers and Supplier India
- Engineering Lab Equipment
- Hospital Lab Equipment
- Water, Sanitation & Hygiene Supplies
- Cold Chain, Solar & Communication Equipment
- Nutrition
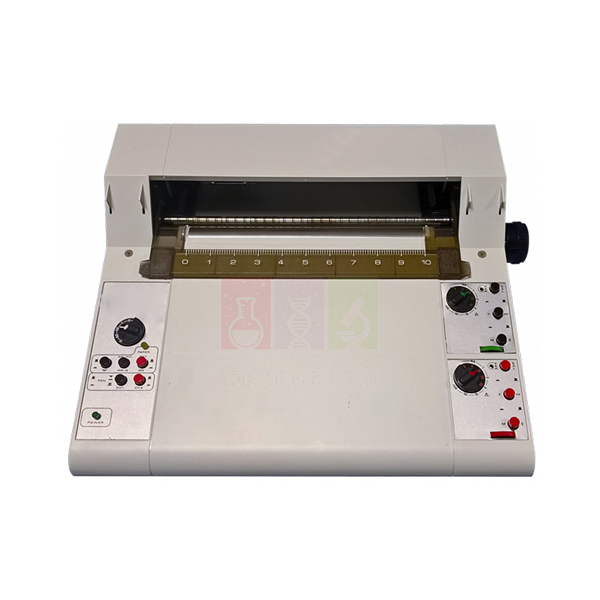
Two Channel Recorder
The Two Channel Recorder draws two electrical signals as ink traces on a moving 200 mm paper chart, so each run leaves a permanent record against time. It accepts inputs from 1 mV to 50 V, offers 16 chart speeds and has a separate electric pen-lift for each channel. It is listed for use with the Flight Demonstration Wind Tunnel.
Two Channel Recorder specifications
| Parameter | Detail |
|---|---|
| Recorder type | Two-pen chart recorder |
| Chart width | 200 mm |
| Input range | 1 mV to 50 V |
| Versions | 1-channel and 2-channel |
| Chart speeds | 16 speeds from 0.1 to 20, in mm/sec or mm/min |
| Pen lift | Separate electric pen-lift on each channel |
| Pens | Long-life fibre-tip pens |
| Listed for use with | Flight Demonstration Wind Tunnel |
| Product code | SLE/EA/04 |
| Minimum order | 10 units |
| Dispatch | Usually within 7 to 10 working days |
| Manufacturer | ScienceLab (Jain Scientific Equipments Pvt Ltd), Ambala, India |
Recording tasks in the aerodynamics lab
Wind tunnel runs. Connect the two inputs to the signal outputs of the Flight Demonstration Wind Tunnel and start the chart before the airflow is changed. Both pens then show how the signals respond on one time base, and students measure delays and settling times with a ruler.
Setting the range before a run. Measure each signal with an Advanced Digital Multimeter first, then choose a range that lets the highest expected value cross most of the chart width. A trace that hits the edge loses data, and one that hugs the baseline is hard to read.
Paper and screen together. A dual trace oscilloscope shows events too fast for a pen to follow. Students view the quick part of a test on the screen, then record the slower part on paper so it can be measured, annotated and pasted into the lab report.
Volts from millimetres. Before a run, feed each channel a steady voltage from a cell, checked on the Advanced Digital Multimeter, and mark where the pen settles. Students then convert trace heights to volts instead of trusting the range setting alone.
Frequently Asked Questions About the Two Channel Recorder
How do I choose the input range for each channel?
Estimate or measure the peak signal first. Then pick the range that moves the pen across most of the 200 mm chart at that value. If the pen hits its end stop, step to a less sensitive range; if the trace barely leaves zero, step to a more sensitive one.
The peaks on my trace are squashed together. What should I change?
Change the chart speed, not the input range. A faster speed spreads events along the paper and a slower speed packs them closer. Use the mm/sec settings for quick changes and the mm/min settings for long, gradual runs.
Why did the paper hardly move during my run?
Check whether the speed was set in mm/min instead of mm/sec. The same number in mm/min moves the paper sixty times more slowly, so a short test leaves only a few millimetres of trace.
Why is one pen not drawing a line?
Make sure the pen cap is off and the pen-lift for that channel is lowered. If the line is faint or broken, the fibre tip may have dried out. Recap the pens after each session and fit a new pen when the ink runs low.
Can the recorder log a single signal?
Yes. Raise the unused pen with its electric pen-lift and record on one channel only. The recorder is also listed in a 1-channel version for laboratories that never need a second trace.
How can students check that the chart speed is right?
Time a short interval with a stopwatch, mark the start and end on the chart and measure the gap. Distance divided by time should equal the selected speed. A large difference points to the wrong speed unit or to paper that is slipping.
Wind tunnels and signal measuring instruments
- Flight Demonstration Wind Tunnel
- Subsonic Wind Tunnel
- Flow Visualisation Wind Tunnel
- Oscilloscope Dual Trace
- Advanced Digital Multimeter
To request a quotation, send the product name, code and quantity through our contact page or add the item to your enquiry cart.
Last updated: 20 November 2026